| View Issue Details [ Jump to Notes ] | [ Print ] | ||||||||
| ID | Project | Category | View Status | Date Submitted | Last Update | ||||
| 0011971 | ParaView | (No Category) | public | 2011-03-15 14:43 | 2014-08-29 11:00 | ||||
| Reporter | Ken Moreland | ||||||||
| Assigned To | Utkarsh Ayachit | ||||||||
| Priority | normal | Severity | minor | Reproducibility | have not tried | ||||
| Status | closed | Resolution | fixed | ||||||
| Platform | OS | OS Version | |||||||
| Product Version | |||||||||
| Target Version | 4.2 | Fixed in Version | 4.2 | ||||||
| Summary | 0011971: 2D Charts Sometimes Pick Ugly Colors | ||||||||
| Description | Although a lot of thought went into choosing the colors for 2D charts, the way colors are selected sometimes undermines the color palette. For an example, do the following: 1. Load can.ex2, load all variables, apply. 2. Plot Over Line. Apply. The resulting plot (an example is attached) has terrible colors. The colors have poor contrast with each other and with the background. In addition, it just does not look good. The problem is that colors are assigned to all variables, but only a few are actually drawn (some are suppressed for good reason). The best colors are the first in the list, and most of those are skipped over. | ||||||||
| Tags | No tags attached. | ||||||||
| Project | Sandia | ||||||||
| Topic Name | fix_chart_panels | ||||||||
| Type | incorrect functionality | ||||||||
| Attached Files | 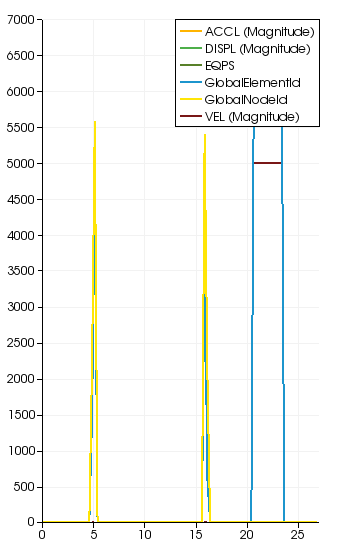 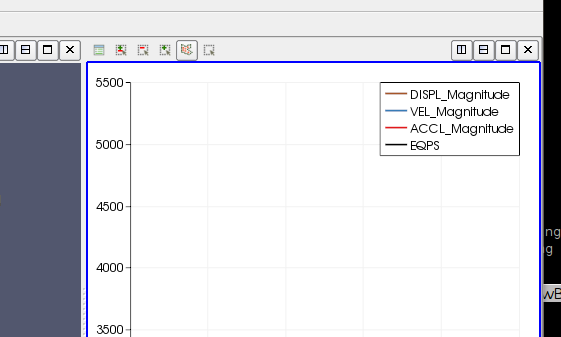 | ||||||||
| Relationships | |
| Relationships |
| Notes | |
|
(0025790) Ken Moreland (manager) 2011-03-15 14:45 |
I'm not sure what is the "right" thing to do here. Perhaps all components of a vector could be assigned the same color (or perhaps different shades of the same color). Since most of the hidden series are vector components, that might be a good enough solution. |
|
(0032315) Utkarsh Ayachit (administrator) 2014-02-13 14:17 |
Not saying this has been resolved for good, but the changes in logic to pick the default colors seems have overcome this issue for this particular use-case (see attached image). We can revisit as and when needed. |
|
(0032335) Utkarsh Ayachit (administrator) 2014-02-15 08:58 |
Topics merged into master: 14511-qt5-support assembly-exporter catalyst-rendering-fix easy_subclassing fix_chart_panels fix_parallel_amrconnectivity remove_duplicate_pqColorTableModel robust_pca view-settings visit-bridge-update-2.7.0 |
|
(0032362) Alan Scott (manager) 2014-02-20 22:21 |
Looks good. I did Ken's test below, then went to last timestep. Colors look OK. Tested master, remote server, Linux. |
| Notes |
| Issue History | |||
| Date Modified | Username | Field | Change |
| 2011-03-15 14:43 | Ken Moreland | New Issue | |
| 2011-03-15 14:43 | Ken Moreland | File Added: PlotColors.png | |
| 2011-03-15 14:45 | Ken Moreland | Note Added: 0025790 | |
| 2013-01-08 21:30 | Alan Scott | Project | => Sandia |
| 2013-01-08 21:30 | Alan Scott | Type | => incorrect functionality |
| 2014-02-13 14:15 | Utkarsh Ayachit | File Added: Screenshot from 2014-02-13 14:15:33.png | |
| 2014-02-13 14:17 | Utkarsh Ayachit | Topic Name | => fix_chart_panels |
| 2014-02-13 14:17 | Utkarsh Ayachit | Note Added: 0032315 | |
| 2014-02-13 14:17 | Utkarsh Ayachit | Status | backlog => gatekeeper review |
| 2014-02-13 14:17 | Utkarsh Ayachit | Fixed in Version | => git-next |
| 2014-02-13 14:17 | Utkarsh Ayachit | Resolution | open => fixed |
| 2014-02-13 14:17 | Utkarsh Ayachit | Assigned To | => Utkarsh Ayachit |
| 2014-02-15 08:58 | Utkarsh Ayachit | Fixed in Version | git-next => git-master |
| 2014-02-15 08:58 | Utkarsh Ayachit | Status | gatekeeper review => customer review |
| 2014-02-15 08:58 | Utkarsh Ayachit | Note Added: 0032335 | |
| 2014-02-20 22:21 | Alan Scott | Note Added: 0032362 | |
| 2014-02-20 22:21 | Alan Scott | Status | customer review => closed |
| 2014-06-17 09:22 | Utkarsh Ayachit | Target Version | => 4.2 |
| 2014-08-29 11:00 | Utkarsh Ayachit | Fixed in Version | git-master => 4.2 |
| Issue History |
| Copyright © 2000 - 2018 MantisBT Team |